

The risk you already know
Demand is not the problem. Revenue leaks between electricity delivered and money collected. NGriid makes the energy side visible, transformer by transformer.
NGriid measures electricity across transformers and connected meters. Quasar shows where energy goes, where losses build, and where your team should act.
Find the connection. Know the address.
Give the next step a named owner.
NGriid Demo Network · Simulated demonstration data.
Quasar traces a collection loss from a network total to a transformer on the map, then to a connected consumer at House 40, Jikwoyi, FCT. A technician is assigned a work order carrying that precise address. The film uses on-screen text and music.
The video couldn’t load. Try again or download the film.
Exact location, plus consumer details where applicable.
Named field staff, with the event details attached.
The right person, at the precise address.
Generation shortfalls, gas supply and transmission constraints sit outside any DisCo's control. We don't generate electricity. We don't transmit it. We measure what happens after it reaches your network.
Quasar puts the numbers your team needs side by side:
Put them together and your team can find the gap, send someone to investigate, and track what changes. That is what NGriid makes possible.
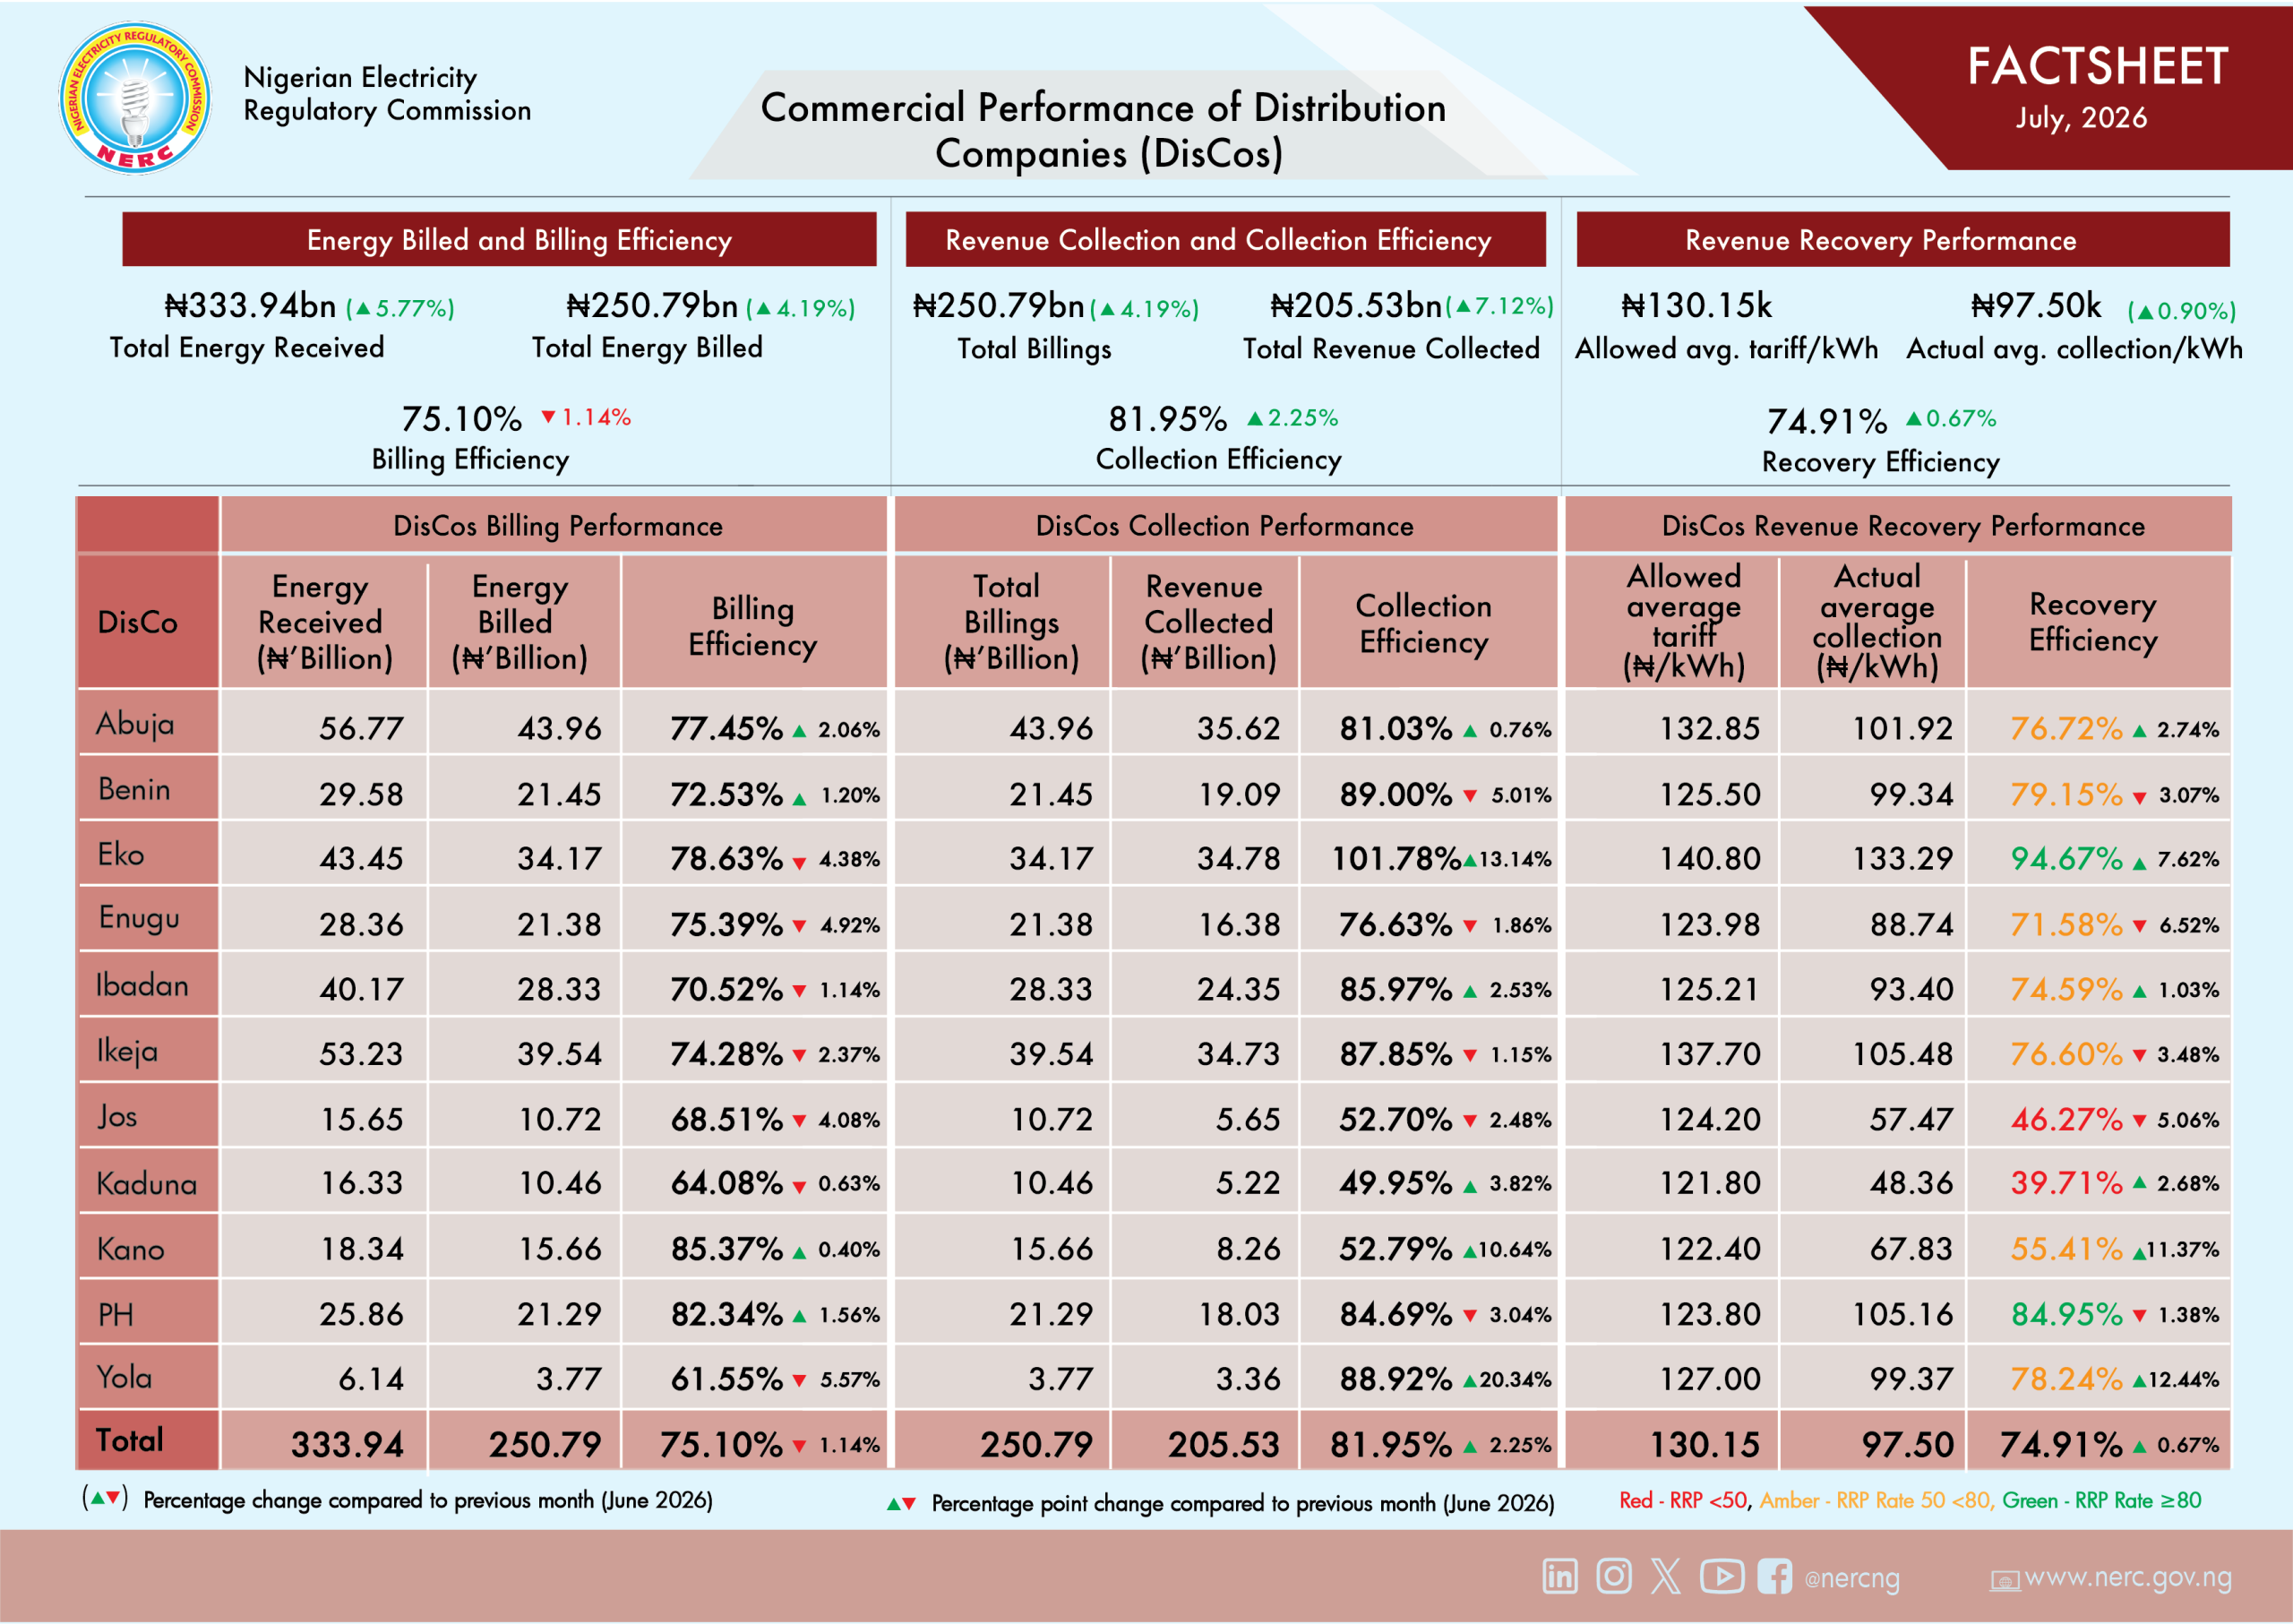
Shortfalls calculated from NERC’s reported energy value, billing and collections: NERC July 2026 commercial factsheet.
Quasar follows electricity from the transformer to the consumer connection and sorts the result into seven useful measures. Scroll to follow the loss from the network total to the next action.
AUG 2025–JUL 2026 · ALL DISCOS · NERC-BASED EXAMPLE
Sources: NERC 2025 Q4 report · NERC 2026 Q2 report · July 2026 commercial factsheet
The transformer meter records electricity entering the transformer. This is the starting point for every loss calculation.
Connected meters show energy used. Quasar separates the energy paid for from the balance still owed.
The gap between energy distributed and energy paid for combines network and collection losses. Drill down to find what drives it.
See outstanding consumer debt by transformer and feeder, separate from physical network loss.
Quasar separates debt linked to active theft alerts so your team can investigate the right connections first.
Bypass and vacant-terminal meters show draw outside a registered consumer connection. Quasar puts it on the map.
Compare metered sections after known draw is accounted for. The remaining difference tells your team where to inspect next.
Quasar turns device readings into a clear picture of energy, losses and unpaid balances.
NGriid devices measure electricity at the transformer and at connected points downstream. You see what entered the network and what reached customers.
Quasar compares readings across the network and pinpoints the sections where electricity goes missing.
Network loss, unauthorized draw and unpaid balances need different responses. Quasar keeps them separate.
Loss alerts name the transformer, connection and time window. Your field team knows where to go.
A number you can't investigate is a number you can't act on. Click a loss figure in Quasar and it opens: the transformers, the time windows, the kilowatt-hours, then the individual NGriid device and the street address it sits at. Your team gets a work order instead of a suspicion.
RISING LOSS IS FLAGGED IN RED.
Your losses are already happening. We show where to start fixing them.
Talk to our grid teamSee how much electricity enters each transformer and how much reaches connected meters. Find the gap while there is still time to act.
When a bypass or unusual draw points to a connection, send your team to the right place at the right time.
Trace each reported energy and loss figure back to measured network activity. Give billing and collections teams a clear starting point.
Put unpaid balances beside the network readings. Send field teams where losses and recoverable debt meet.
Demand is not the problem. Revenue leaks between electricity delivered and money collected. NGriid makes the energy side visible, transformer by transformer.
Once you can locate a loss, you can send the right team, measure the result, and repeat what works.
Recovering even one point of loss creates new revenue without building new generation. Measured recovery is easier to manage and finance.
MEASURE THE LOSS → RECOVER THE REVENUE → FINANCE THE NETWORK
We instrument a single feeder end to end and hand you thirty days of measurement. If the numbers don't justify scaling, you'll know that too — and you'll know it from data rather than a guess.
QUASAR CONSOLE ACCESS INCLUDED